4-bed property in 44102 at $80K asking with $30K repairs ($110K all-in) generating strong rental returns: 9.8% cap rate, 14.5% cash-on-cash with 25% down, and $333/month cash flow. Best exit is buy-and-hold rental or BRRRR ($256/month after refinance) since ARV of $125K leaves minimal flip margin after costs. Serious caution: violent crime is 315% above US average and neighborhood vacancy is high at 21%, which may impact tenant quality and long-term hold risk.
Pick your exit
Tap one to see its numbers
ARV$125,000
All-in (price + repairs)$110,000
Buying 2% + 6-mo carrying costs$11,800
Selling 8%$10,000
Profit−$6,800 · -5%
Voucher rent (2 units)$2,260/mo
Operating costs + vacancy$1,035/mo
Mortgage$563/mo
Cash flow$662/mo · $7,944/yr
Cash-on-cash28.9%
Market rent$1,800/mo
Operating costs + vacancy$905/mo
Mortgage$563/mo
Cash flow$333/mo · $3,992/yr
Cash-on-cash14.5%
Refinance at 75% of ARV$93,800
Cash left in the deal$16,300
New payment$640/mo
Cash flow after refi$256/mo
Deal score
How it stacks up, out of 100
Day-one equity12%
Cash flow$333/mo
Appreciation+2%/yr
Schools2.5★
CrimeHigh
Flood riskMinimal
Comp confidenceMedium
Investor demandHigh
Voucher vs market rent+$460/mo
Repair estimate
$30,000 total · $25/sq ft · typical split for this scope
Kitchens$5,400
Mechanicals (HVAC, electric, plumbing)$6,000
Bathrooms$4,500
Flooring$3,900
Paint & drywall$3,300
Windows & doors$2,700
Exterior, roof & porch$2,700
Contingency$1,500
Condition notes
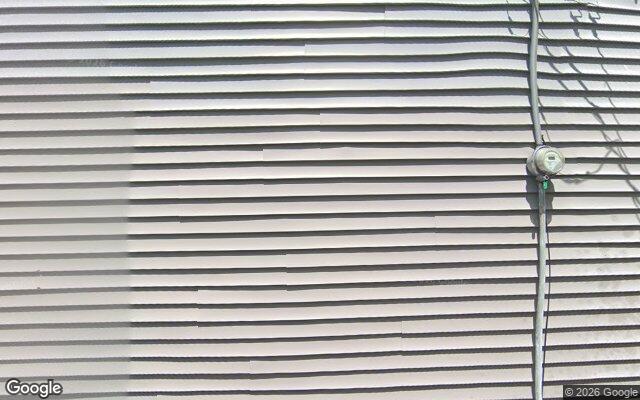
🏠Exterior from Street View looks fair: Industrial-style metal siding shows significant weathering and maintenance needs, suggesting deferred upkeep that would require exterior renovation investment.
🔑Access and walkthrough times: book in the box on the right.
Upside & risks
Upside
🏘2 units: one can carry the mortgage, or live in one and rent the other.
🎫Vouchers pay $460/mo more than market rent here (HUD FY2026 rents for 44102).
🛏5 bedrooms: Rents for about 50% more than the ZIP's typical home; a strong fit for families and Section 8 tenants.
Risks
⚠Violent crime 315% above the US average in this police area.
⚠High vacancy in this neighborhood (21.2% of homes).
ℹTwo-family: check the city's rental registration and inspection rules before renting.
ℹTaxes are estimated from the school district and county levies; check the county treasurer for the exact bill.
✓Flood zone X, taxes current.
Market rent vs Section 8 voucher
HUD FY2026 · ZIP 44102
Market tenant$1,800/mo
Cash flow at 25% down$333/mo
Cash-on-cash14.5%
Cap rate9.8%
Our team's rent estimate · ZIP typical $1,356
✓ Section 8 · 2 × 2-bed$2,260/mo
Cash flow at 25% down$662/mo
Cash-on-cash28.9%
Cap rate13.4%
HUD FY2026 Small Area FMR. Housing authorities pay 90–110% ($2,034–$2,486). Confirm the payment standard with CMHA / AMHA before you buy.
Voucher rent by bedroom in 44102
Cleveland, OH HUD Metro FMR Area. Price each unit by its bedroom count.
Rental pro forma
At market rent · all-in $110,000
Year 1
Gross rent ($1,800 × 12)$21,600
Vacancy 6%− $1,296
Property taxes (today)− $3,820
Insurance (est.)− $900
Repairs 8% · mgmt 10% · reserves 5%− $4,838
Net operating income$10,746 · $896/mo
Loan 25% down · 7.25% · 30 yr$563/mo
Cash flow$333/mo
Where each rent dollar goes
5-year wealth build
Equity = value − loan · market rent
EquityLoan balanceCash flow collected (running)
Year
Gross rent
NOI
Cash flow
Loan bal.
Value
Equity
1
$21,600
$10,746
$3,992
$81,702
$121,500
$39,798
2
$22,054
$10,952
$4,199
$80,843
$118,100
$37,257
3
$22,517
$11,163
$4,409
$79,921
$114,800
$34,879
4
$22,990
$11,378
$4,624
$78,929
$111,600
$32,671
5
$23,472
$11,596
$4,843
$77,862
$108,500
$30,638
5-yr
$55,835
$22,067
$30,600
Rent grows 2.1%/yr and value -2.8%/yr from ZIP 44102 trends. Expenses grow 2.5%/yr.
Typical home value (Zillow index) · dotted = our projection
Last 12 months-2.8%
5 years10.6%
10 years84%
Rents, 12 months2.1%
Neighborhood
Census Tract 1018
Who lives here
Owners41%
Renters60%
Vacant homes21%
In poverty31%
Median household income$33,864
Median rent (census)$753
Safety
Violent crime vs US315% higher
Property crime vs US156% higher
City-wide, Cleveland Police Department (FBI). Block-level crime data coming
Flood & hazards
FEMA flood zoneZone X · minimal
Schools
Cleveland Municipal2.5★
Clark School · 0.4 mi4.5★
Max S Hayes High School · 0.5 mi2★
Graduation rate76.5%
Investor market
Home sales, 12 mo219
Bought by investors49%
Likely flips resold77
Typical $/sq ft$108
Rent-to-value (monthly)1.44%
Comparable sales
within 0.75 mi, last 18 months, size ±30%
Price per sq ft
Map of comps
Live map with comp pins data coming
Comps used5
Comp range$123k–$133k
ConfidenceMedium
#
Address
Sold
Price
Sq ft
Beds
$/sq ft
Miles
1
2101 W 83 St
Feb 2026
$150,000
1,480
2
$101
0.23
2
7903 Neville Ave
Feb 2026
$121,000
1,518
7
$80
0.47
3
2117 W 81 St
Dec 2025
$150,000
1,386
6
$108
0.18
4
2069 W 98 St
Aug 2025
$170,000
1,558
5
$109
0.66
5
7128 Brinsmade Ave
Jun 2025
$2,104,695
1,440
6
$1462
0.34
Sources: county sale and tax records · Zillow ZIP indexes · HUD FY2026 Small Area Fair Market Rents · FEMA · Ohio report cards · FBI · US Census · Google Street View. All figures are estimates, not an appraisal; buyer does their own due diligence.
 Google Street View · 2026-05📸 Interior photos & video: data coming